
Kensington and Chelsea's claimant count rose by 95 to 3,520 in September, the biggest monthly rise this year, but it is still 85 lower than a year ago at 3.4%.
3,520 people in Kensington and Chelsea were claiming unemployment-related benefits in September. That is 95 more than in August, the largest monthly rise in the borough this year. (ONS claimant count via nomis)
It is still 85 fewer than in September 2025, when the count was 3,605. The rate is unchanged at 3.4% of residents aged 16 to 64.
The rise was not peculiar to the borough. London’s count went up by about 10,200 in the same month, and the United Kingdom’s by about 35,800.
The last 13 months
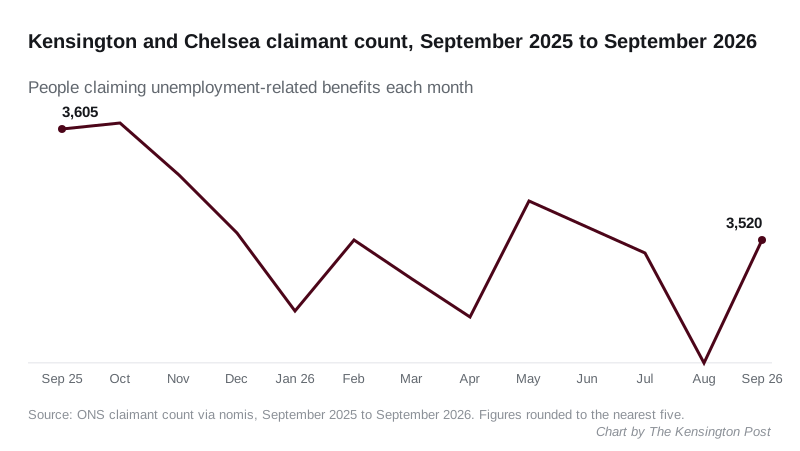
The count drifted down through the winter and spring, from 3,605 in September 2025 to 3,460 in April. It edged up in May, eased again over the summer and hit 3,425 in August, its lowest point in the period. September then took it back to where it was in February.
| Month | Claimants | Rate (16 to 64) |
|---|---|---|
| September 2025 | 3,605 | 3.5% |
| December 2025 | 3,525 | 3.5% |
| March 2026 | 3,490 | 3.4% |
| June 2026 | 3,530 | 3.5% |
| July 2026 | 3,510 | 3.4% |
| August 2026 | 3,425 | 3.4% |
| September 2026 | 3,520 | 3.4% |
How the borough compares
Kensington and Chelsea has the fourth lowest claimant rate of London’s 33 local authorities. Only the City of London (1.1%), Richmond upon Thames (2.6%) and Kingston upon Thames (3.2%) are lower.
- London as a whole: 5.6%, up from 5.4% in August
- United Kingdom: 3.9%, up from 3.8%
- Highest in London: Newham and Barking and Dagenham, both 7.5%
Neighbouring Westminster is at 4.0%.
Inside the borough
The borough average hides a wide spread. Ward figures for September are not yet published; the latest, for August, show:
- Dalgarno, W10: 6.9%, the highest
- Golborne, W10: 6.2%, the most claimants of any ward at 395
- Chelsea Riverside: 5.6%
- Notting Dale: 5.5%
- Campden, W8: 0.9%, the lowest
Dalgarno’s rate is more than seven times Campden’s. The four highest wards account for about 1,365 of the borough’s 3,420 claimants in the ward figures, or two in every five. Every ward’s July figures are in our July claimant count story.
What it means for you
- The claimant count is not the unemployment rate. It counts people on Jobseeker’s Allowance and those on Universal Credit who are required to look for work. Some people in work but on low pay are included.
- One month is not a trend. A September rise was also seen across London and the UK. The October figure, due in November, will show whether it holds.
- Figures are rounded to the nearest five, so ward totals do not add exactly to the borough figure.
- If you are looking for work, the council lists free help on its jobs, employment and skills pages.
The figures come from the Office for National Statistics’ claimant count, published through nomis.
Have your say