
Kensington and Chelsea's claimant count fell to 3,565 in July, joint fourth lowest of 33 London boroughs. Inside it, Dalgarno's rate is eight times Campden's.
3,565 people in Kensington and Chelsea were claiming unemployment-related benefits in July, 3.5% of residents aged 16 to 64. That is down from 3,665 a year earlier and 3,830 two years ago, and it is the joint fourth lowest rate of the 33 London boroughs. (ONS claimant count via nomis)
The borough sits well below London, where 5.6% of working-age residents claim, and below the United Kingdom figure of 3.9%.
That is the borough average. It is also close to meaningless as a description of any actual street here.
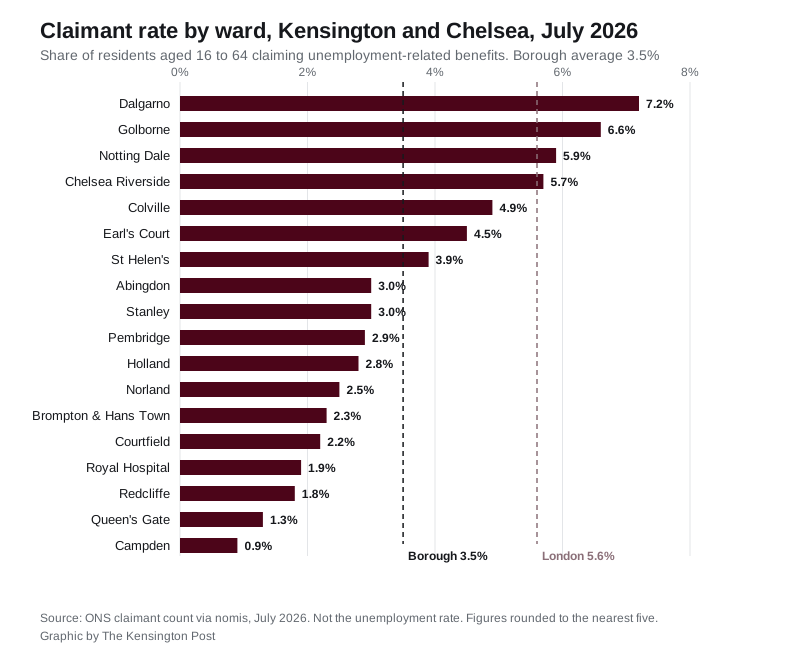
Ward figures published for the same month put Dalgarno, a W10 ward in North Kensington, at 7.2%. Campden, in W8, is at 0.9%. One rate is eight times the other, in the same borough, under the same council.
Where the claims are
Every ward in the borough, July 2026, by the share of 16 to 64 year olds claiming:
| Ward | Rate (16 to 64) | Claimants |
|---|---|---|
| Dalgarno | 7.2% | 355 |
| Golborne | 6.6% | 420 |
| Notting Dale | 5.9% | 365 |
| Chelsea Riverside | 5.7% | 305 |
| Colville | 4.9% | 275 |
| Earl's Court | 4.5% | 305 |
| St Helen's | 3.9% | 165 |
| Abingdon | 3.0% | 175 |
| Stanley | 3.0% | 175 |
| Pembridge | 2.9% | 110 |
| Holland | 2.8% | 185 |
| Norland | 2.5% | 95 |
| Brompton & Hans Town | 2.3% | 130 |
| Courtfield | 2.2% | 145 |
| Royal Hospital | 1.9% | 105 |
| Redcliffe | 1.8% | 125 |
| Queen's Gate | 1.3% | 80 |
| Campden | 0.9% | 55 |
| Borough | 3.5% | 3,565 |
Seven wards are above the borough average and eleven are below it. The top three, Dalgarno, Golborne and Notting Dale, are all W10 wards in North Kensington. The fourth, Chelsea Riverside, is at the southern end of the borough.
By headcount rather than rate, Golborne is the largest single group in the borough at 420 claimants, more than seven times Campden’s 55.
Put Dalgarno’s 7.2% next to the London boroughs rather than the Kensington wards and the scale is clearer. Only three boroughs in the capital are higher: Newham, Haringey, and Barking and Dagenham, all on 7.5%. Dalgarno is level with Enfield and Brent. The borough it sits inside is joint fourth lowest.
The ward series only starts in January 2026, so there is no year-earlier ward figure to compare. Within 2026, Dalgarno has gone from 310 claimants in January to 355 in July, a rise of 45. Golborne has moved from 410 to 420 and Campden from 60 to 55.
The under-25 figure that goes the other way
Across Britain, the striking movement in this data for the past two years has been young claimants. Kensington and Chelsea is one of the very few places where it has not happened.
| Area | July 2024 | July 2025 | July 2026 | Two-year change |
|---|---|---|---|---|
| Kensington and Chelsea | 430 | 395 | 410 | -4.7% |
| London | 46,120 | 50,190 | 52,665 | +14.2% |
| United Kingdom | 284,290 | 299,680 | 328,865 | +15.7% |
Ranked across all 33 London boroughs on that two-year change, Kensington and Chelsea is 32nd. Only Westminster, down 6.6%, has done better. At the other end, Kingston upon Thames is up 31.0%, Greenwich 28.1% and Bexley 27.0%.
Two cautions on that. The borough’s under-25 numbers are small, in the hundreds rather than the thousands, and ONS rounds them to the nearest five, so a change of 15 is not a trend. The count also did rise on the year, from 395 to 410. What is solid is the two-year direction, and that it runs against London and the UK.
The 25 to 49 group has fallen more clearly, from 2,205 in July 2024 to 2,000 this July, down 9.3%.
What the claimant count is, and is not
Four things worth knowing before anyone calls this an unemployment rate.
- It is not the unemployment rate. It counts people claiming unemployment-related benefits, mainly Universal Credit, and that is a different measure with different rules.
- It includes some people who are working. Universal Credit claimants on low earnings can be subject to work-search conditions and are counted here.
- It is not seasonally adjusted. July always carries school and college leavers, which is why every comparison above is July against July.
- The figures are rounded to the nearest five. The ward totals add to 3,570 against a borough figure of 3,565 for that reason.
What it means for you
If you are out of work and living in the borough, the council runs the Families and Communities Employment Service, known as FACES. It assigns an employment coach who meets you at least once a week for up to six months, at home or somewhere local if you prefer, and covers CV writing, interview practice, courses and English classes, plus benefits, childcare and housing advice. The number is 0207 361 2070. (RBKC, Families and Communities Employment Service)
The council’s wider jobs and skills pages, including apprenticeship support, are at rbkc.gov.uk/jobs-employment-and-skills.
If you are reading this as a picture of the borough, the single number to carry away is not 3.5%. It is that a borough with one of London’s lowest claimant rates contains a ward whose rate would place it fourth highest among all 33 London boroughs.
The next claimant count release, covering August 2026, is due on 15 September 2026.
Related: Kensington house prices: flats under £1m, first since 2013 and Kensington planning news.
Have your say