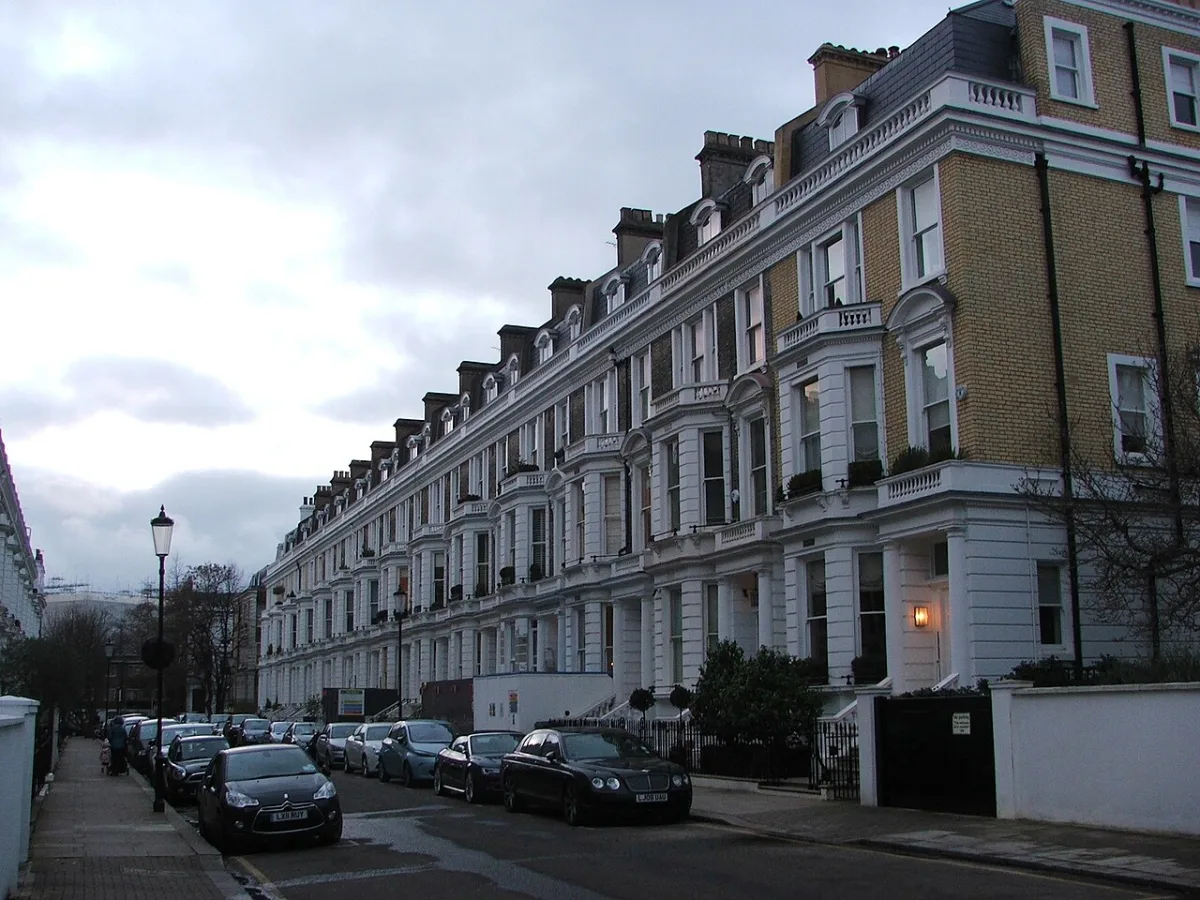

The average Kensington and Chelsea home sold for £1,250,149 in June 2026, down 14.7% in a year, and the average flat is now under £1m. Prices by property type.
Kensington and Chelsea is still the most expensive local authority area in the country to buy a home in, and it is also one of the fastest falling. The average sale completed in the borough in June 2026 came in at £1,250,149, which is 14.7% lower than a year earlier. Over the same twelve months prices across England as a whole rose 1.8%.
Both numbers come from the UK House Price Index, which is built from completed HM Land Registry sales rather than asking prices. Everything below is from that dataset unless stated otherwise. It is a mean average, not a median, which matters more here than almost anywhere.
This page is updated with each monthly release. The June 2026 figures are covered in more depth in Kensington house prices: flats under £1m, first since 2013.
The headline figures
| Area | Average price | Annual change |
|---|---|---|
| Kensington and Chelsea | £1,250,149 | −14.7% |
| City of Westminster | £854,198 | −25.4% |
| Camden | £833,067 | −7.1% |
| Richmond upon Thames | £818,949 | −0.3% |
| Hammersmith and Fulham | £725,562 | −13.3% |
| Wandsworth | £680,105 | −5.2% |
| London | £553,870 | −2.5% |
| England | £293,262 | +1.8% |
The gap is enormous in both directions. A Kensington and Chelsea average is more than four times the England average, and about £696,000 clear of the average for London as a whole. Of the 295 local authority areas in England, only City of Westminster and City of London fell faster than this borough over the year.
That combination is worth understanding before you read anything into it. The borough records only a few dozen to a few hundred completed sales a month, and the mix of what sells swings the average hard. A quiet quarter for £5 million houses in Chelsea and a busier one for flats in North Kensington will move the headline number a long way without any individual home changing in value.
What you pay by property type
The single most useful number on this page for most people is not the headline. It is the £991,929 average for a flat or maisonette, because that is the market almost everyone buying in the borough is actually in. Houses of any kind are a small and very expensive minority of what changes hands here. June 2026 is the first month the flat average has been below £1 million since June 2013.
The house figures show why the borough average behaves the way it does. A detached house averaged £4,453,900, a semi-detached £2,985,886 and a terrace £2,400,183. There are not many detached houses in Kensington and Chelsea, and when a handful sell in a given month they pull the whole average up.
Every type fell over the year, and by broadly similar amounts: flats 15.3%, detached 14.1%, semi-detached 13.1%, terraced 12.5%.
First-time buyers and movers
The same dataset splits buyers rather than buildings. In June 2026 a first-time buyer in the borough paid an average of £1,065,235, and a former owner occupier paid £1,486,573.
A first-time buyer average above a million pounds is the plainest measure of what this borough is. It is more than four times the England-wide first-time buyer average of £245,450. Anyone buying their first home in Kensington, Chelsea or Notting Hill on an ordinary salary is, in practice, buying with help or buying a share.
How far prices have come down
The borough’s house price index reading was 84.8 in June 2026. The index is set to 100 for January 2023, so the average sale in the borough is running around 15% below where it was three and a half years ago. Measured from the borough’s own record month, September 2022, when the average was £1,656,986, prices are down £406,837, or 24.6%.
| Month | Average price | Annual change |
|---|---|---|
| June 2025 | £1,466,106 | +2.2% |
| September 2025 | £1,381,394 | −1.9% |
| December 2025 | £1,292,317 | −3.0% |
| March 2026 | £1,300,757 | −4.2% |
| April 2026 | £1,323,967 | −4.7% |
| May 2026 | £1,262,938 | −10.2% |
| June 2026 | £1,250,149 | −14.7% |
The annual fall sat between 3% and 5% through the winter and then widened sharply in May and June. That is partly the market and partly arithmetic: the comparison months in mid-2025 were the strongest of that year, so each new month is now measured against a higher base.
These monthly figures move after first publication. May 2026 was first released at £1,255,567 and has since been revised up to £1,262,938. Treat the newest month on this table as the least settled one.
What it means if you live here
If you are selling, the borough is not a place where an asking price sets itself. Prices completing now are below prices completing a year ago across the board. Work from completed sales, not from asking prices or a 2025 valuation.
If you are buying, the fall is real but it is a fall from an extraordinary level. A million pounds still buys a flat, not a house, in most of the borough. It is worth checking the parking permit cost if you keep a car, and what is proposed nearby on our Kensington planning news page, because both outlast whatever the market does.
If you are staying put, nothing on this page is a loss until you sell. It does affect the valuation a lender uses at remortgage.
If you own a home worth £2 million or more, the new High Value Council Tax Surcharge starts in April 2028 and is charged on top of council tax. See Kensington mansion tax: £2,500 to £7,500 a year from 2028.
A warning about postcodes
Kensington and Chelsea is a small borough with leaky edges, and this matters whenever you read a “Kensington” price figure that is not borough-based. Of the nine postcode districts that cover the borough, only W8 and SW5 sit wholly inside it. SW3, SW7 and SW1X are shared with Westminster; SW10 and W14 with Hammersmith and Fulham; W11 with Westminster, Ealing and Hammersmith and Fulham; and W10 with five boroughs.
So a postcode-level average labelled Kensington or Chelsea will usually contain sales that are legally in another borough. The figures on this page are the local-authority ones, which do not have that problem.
Frequently asked questions
What is the average house price in Kensington and Chelsea?
£1,250,149 for sales completing in June 2026, according to the provisional UK House Price Index. That covers every property type across the whole borough, and it is a mean average.
Are Kensington house prices falling?
Yes. Prices were down 14.7% in the year to June 2026, the third-steepest fall of the 295 local authority areas in England. England as a whole rose 1.8% over the same period.
How much is a flat in Kensington and Chelsea?
An average of £991,929 in June 2026, the first month under £1 million since June 2013. Flats and maisonettes are the bulk of what sells in the borough, so this figure is closer to most buyers’ reality than the headline average is.
Is Kensington and Chelsea the most expensive borough in London?
Yes, and the most expensive local authority area in the UK. At £1,250,149 it is £395,951 ahead of the next highest, the City of Westminster at £854,198.
Where can I check what a specific house sold for?
Every completed sale in England and Wales is public. Search a street or an address for free on the HM Land Registry Price Paid service.
When is the next update?
The UK House Price Index covering July 2026 is due at 9.30am on 16 September 2026.
Sources
- UK House Price Index, Kensington and Chelsea (ONS and HM Land Registry) for the borough average, property-type and buyer-type figures and the monthly series.
- Land Registry UKHPI open data for the comparator boroughs, London and England figures.
- HM Land Registry Price Paid search to check any individual address.
Figures are provisional and are revised as more sales complete. Confirm the latest numbers against the linked sources before making any decision.
Have your say