
We reported June's flat average as £991,929, under £1m. Land Registry has since revised June up to £1,003,947. The correction and the July figures are below.
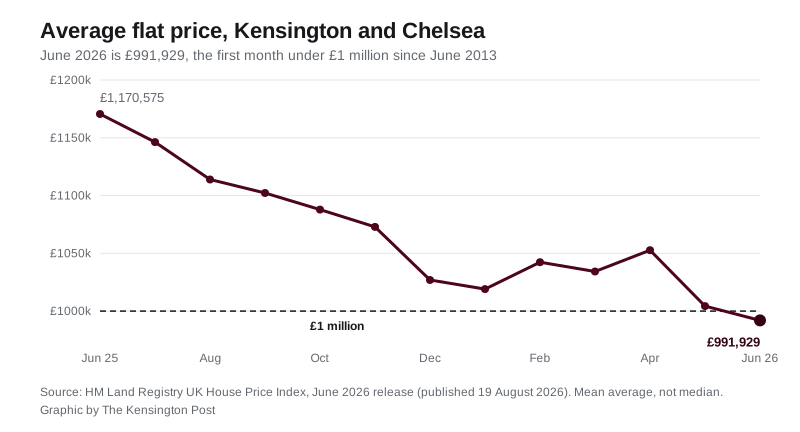
The average flat sold in Kensington and Chelsea in June went for £991,929. That is the first month below £1 million since June 2013, thirteen years ago. (HM Land Registry UK House Price Index)
Flats are roughly the borough in miniature. They are what most people here buy and sell, and their average has now fallen 15.3% in twelve months, from £1,170,575 in June 2025.
The borough as a whole tells the same story. The average Kensington and Chelsea home sold for £1,250,149 in June, down £215,957, or 14.7%, on a year earlier. That is the lowest borough average since December 2013.
Third-steepest fall in England, and still the dearest place in the country
Both things are true at once, and they are the point of this release.
Of the 295 local authority areas in England, only two fell faster than Kensington and Chelsea over the year to June:
- City of Westminster, down 25.4%
- City of London, down 20.4%
- Kensington and Chelsea, down 14.7%
- Hammersmith and Fulham, down 13.3%
- Tower Hamlets, down 13.1%
Sixty-two of those 295 areas fell at all. The other 233 rose.
Yet the borough is still the most expensive local authority area in the UK by a long way. Second place, Westminster, averages £854,198. The gap between the two is £395,951, more than the average home costs in most of England.
By property type
Every type fell, and the falls are close to each other, between 12.5% and 15.3%.
| Type | June 2026 | June 2025 | Change |
|---|---|---|---|
| Detached | £4,453,900 | £5,187,513 | -14.1% |
| Semi-detached | £2,985,886 | £3,436,020 | -13.1% |
| Terraced | £2,400,183 | £2,744,341 | -12.5% |
| Flat or maisonette | £991,929 | £1,170,575 | -15.3% |
| All types | £1,250,149 | £1,466,106 | -14.7% |
The index also publishes a first-time buyer average. In Kensington and Chelsea it is £1,065,235, down £186,496 on the year.
The borough fell in June while most of London rose
This is the part that separates Kensington from the rest of the capital right now. Prices here fell 1.0% between May and June. Over the same month London as a whole rose 1.0% and England rose 0.2%.
Twelve of the 33 boroughs fell on the month. Kensington and Chelsea was joint fourth-steepest, level with Bromley and Harrow, behind Lewisham, Newham and Islington.
Set against the immediate neighbours, June 2026:
- Kensington and Chelsea £1,250,149, down 14.7% on the year, down 1.0% on the month
- City of Westminster £854,198, down 25.4% on the year, up 1.0% on the month
- Camden £833,067, down 7.1% on the year, up 0.3% on the month
- Hammersmith and Fulham £725,562, down 13.3% on the year, up 1.1% on the month
- Wandsworth £680,105, down 5.2% on the year, up 2.3% on the month
- London £553,870, down 2.5% on the year
- England £293,262, up 1.8% on the year
How far this is from the top of the market
The borough’s highest monthly average in the whole index, which starts in January 1995, was £1,656,986 in September 2022. June 2026 is £406,837 below that, a fall of 24.6% in under four years.
Three things to know about these figures
They are worth reading carefully before anyone treats them as a valuation.
- This is a mean average, not a median. One £30 million sale on a quiet month moves it. In a borough with this spread of property, that matters more than almost anywhere else in the country.
- Recent months get revised. May 2026 was first published at £1,255,567, which is the figure we reported on 20 August. In this release it has been revised up to £1,262,938. June will move too.
- Sales volumes here are small. The index recorded 120 sales in the borough in June 2025. Volumes for recent months are not published yet because registrations are still coming in.
What it means for you
If you are selling. The direction has been one way for a year, and the June figure is the lowest since 2013. Anything valued off a 2025 comparable is likely to be too high. Ask an agent to show you completed sales, not asking prices.
If you are buying. A borough average is not a street average. Prices in Kensington and Chelsea vary enormously by postcode, and the mean is dragged around by a handful of very large sales. Look at completed prices for the actual street.
If you already own. This changes nothing you have to do. It does affect the figure your lender uses at remortgage, and it may affect a council tax banding challenge, though bands still rest on 1991 values.
If you are watching the new surcharge. The High Value Council Tax Surcharge starts in April 2028 and applies to homes worth £2 million or more, valued in 2026. Three of the four property-type averages in this borough are still above that line. We covered the rules in Kensington mansion tax: £2,500 to £7,500 a year from 2028.
The next UK House Price Index, covering July 2026, is due at 9.30am on 16 September 2026.
Our standing reference page, with the longer run of figures and the comparison by type, is Kensington house prices. For what is being built and where, see Kensington planning news.
Correction, 20 September 2026
This article reported that the June 2026 flat average of £991,929 was the first month under £1 million since June 2013. In the July 2026 release, HM Land Registry revised June’s flat average up to £1,003,947, which puts it back above £1 million. The borough average for June was revised up from £1,250,149 to £1,266,683.
The milestone happened a month later than we reported. July’s flat average is £971,688. We have written it up in Kensington flats hit £971,688, lowest since June 2013.
Have your say