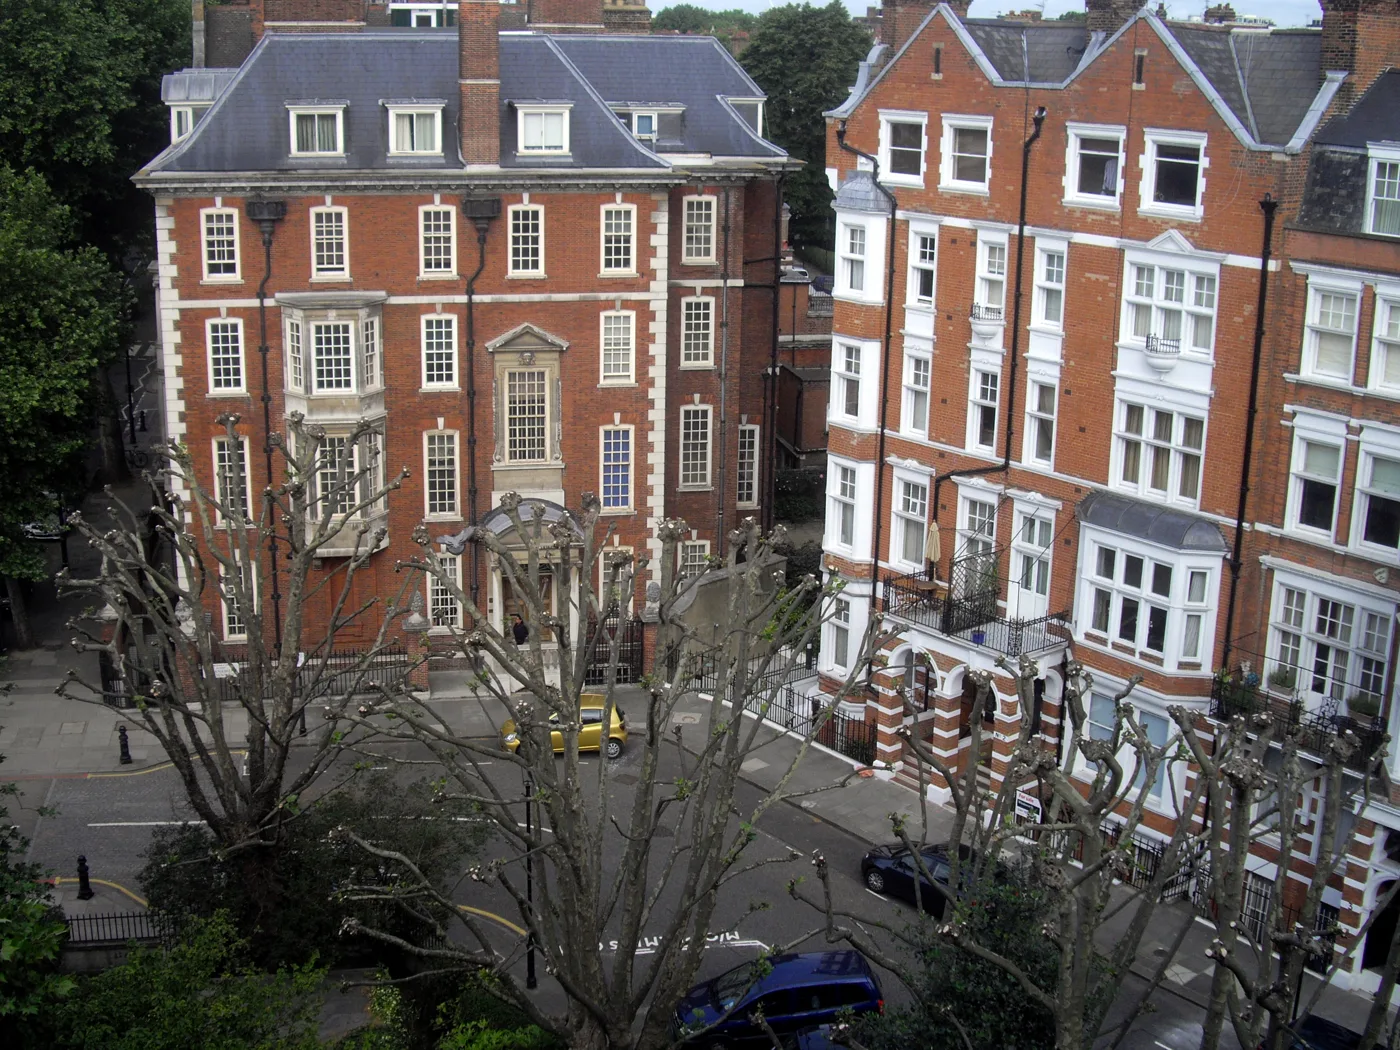

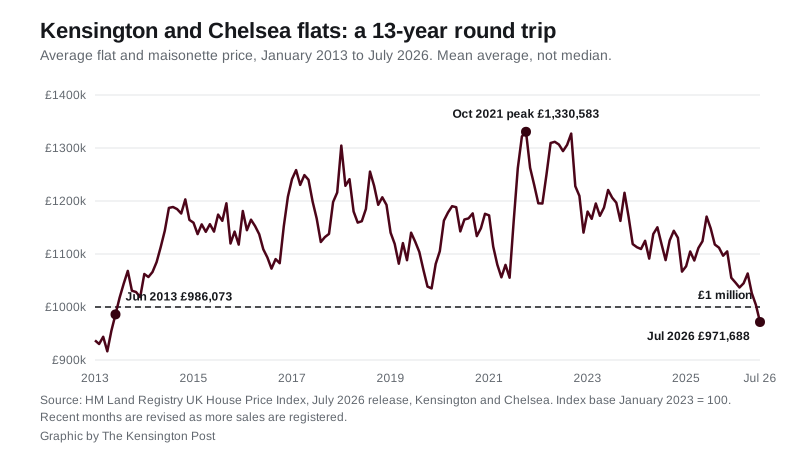
The average Kensington and Chelsea flat sold for £971,688 in July, the first month under £1m since 2013. June has been revised back above the line.
The average flat in Kensington and Chelsea sold for £971,688 in July. That is the first month below £1 million in thirteen years, and £176,618 less than the same month last year. (HM Land Registry UK House Price Index)
We reported that milestone a month early. In August we wrote that June’s flat average of £991,929 was the first under £1 million since 2013. Land Registry has since revised June up to £1,003,947, which puts it back over the line. July is the month it actually happened. We have added a correction note to that article.
The borough as a whole averaged £1,232,640 in July, down £202,092, or 14.1%, on July 2025. The last time the borough average was lower was June 2013.
Thirteen years, and back to where it started
The last month flats here averaged under £1 million before July was June 2013, at £986,073. In between, the average reached a peak of £1,330,583 in October 2021.
The borough average tells a shorter version of the same story. In July 2014 it was £1,455,950. Today it is £223,310 below that, twelve years on.
Against the all-time high of £1,656,986 in September 2022, July 2026 is £424,346 lower, a fall of 25.6% in under four years.
By property type
Flats are falling fastest. They are also what most people in the borough buy and sell.
| Type | July 2026 | July 2025 | Change |
|---|---|---|---|
| Detached | £4,525,386 | £4,996,455 | -9.4% |
| Semi-detached | £3,051,816 | £3,272,840 | -6.8% |
| Terraced | £2,429,086 | £2,665,555 | -8.9% |
| Flat or maisonette | £971,688 | £1,148,306 | -15.4% |
| All types | £1,232,640 | £1,434,732 | -14.1% |
The index also publishes a first-time buyer average for the borough. It is £1,045,054, down from £1,226,073 a year ago.
England went up in July. Kensington went down 2.7%
This is the part that has not changed since June. The borough is moving against the country and against the capital.
Between June and July:
- Kensington and Chelsea fell 2.7%
- Camden fell 2.3%
- London as a whole fell 0.1%
- Wandsworth rose 0.8%
- City of Westminster rose 1.1%
- Hammersmith and Fulham rose 1.4%
- England rose 0.7%
Over the year to July, set against the neighbours:
- Kensington and Chelsea £1,232,640, down 14.1%
- City of Westminster £876,788, down 20.7%
- Camden £815,159, down 10.1%
- Hammersmith and Fulham £738,048, down 9.0%
- Wandsworth £686,076, down 5.5%
- London £550,037, down 3.3%
- England £293,479, up 1.1%
Kensington and Chelsea is still the most expensive local authority area in the country, and not narrowly. Westminster, in second place, is £355,852 behind.
London is not an outlier of one borough. July was the eleventh month in a row of falling average prices across the capital, and the region’s annual rate is the lowest since January 2024. (UK House Price Index summary, July 2026)
Very few homes are actually changing hands
The index counts sales as well as prices, and the sales figure is the one that explains the rest.
The most recent month with a published count is May 2026: 68 sales in the whole borough. In May 2025 there were 132. In March 2025, the month the stamp duty thresholds changed, there were 284.
June and July counts are not published yet, and recent months get revised upward as registrations come in. Even allowing for that, the direction is clear, and it matters for how the average behaves: the fewer sales there are, the more one very large or very small transaction moves the number.
Three things to know before you use these figures
- This is a mean average, not a median. In a borough that contains both studio flats and £30 million houses, that distinction does real work. One unusual sale in a 68-sale month shifts the headline.
- Recent months get revised, in both directions. June 2026 was first published at £1,250,149 and has been revised up to £1,266,683. Our August article used the first figure. July will move too.
- The index base is January 2023 = 100. The borough’s index now reads 83.6, so the average home here is worth about 16% less than it was in January 2023.
What it means for you
If you are selling a flat. The comparable that matters is a completed sale from the last three months, not an asking price and not a 2021 valuation. The flat average has fallen 15.4% in a year.
If you are buying. A borough average is not a street average. Kensington and Chelsea spans Knightsbridge and Dalgarno, and the mean hides all of it. Look at completed prices on the actual street and the actual block.
If you are remortgaging. Lenders use indexed values. A 14% fall in the borough average can change the loan-to-value band you land in, and with it the rate you are offered.
If you are watching the £2 million surcharge. The High Value Council Tax Surcharge starts in April 2028, on homes valued at £2 million or more as at 2026. Three of the four property-type averages in this borough are still above that line. The rules are in Kensington mansion tax: £2,500 to £7,500 a year from 2028.
The August 2026 index is due at 9.30am on Wednesday 21 October 2026.
Our standing page, with the longer run of figures, is Kensington house prices. For what is being built and where, see Kensington planning news and our report on the Notting Hill Gate scheme approved this month.
Have your say