
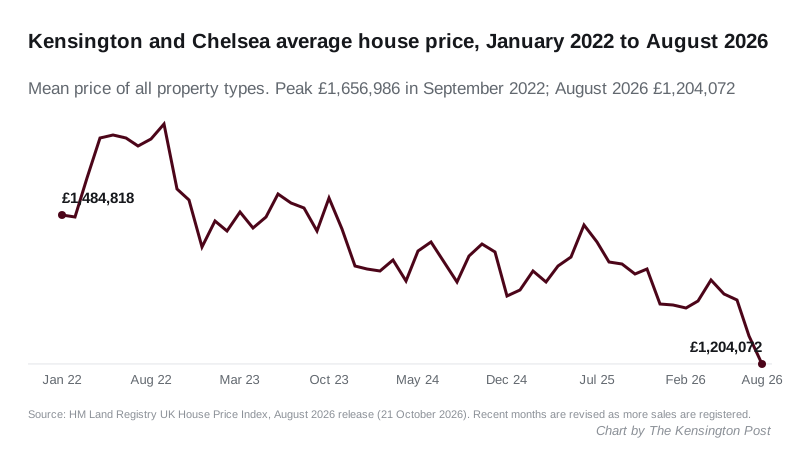
The average Kensington and Chelsea home sold for £1,204,072 in August, down 13.8% in a year and the lowest since May 2013. Rents rose 3% to £3,739.
The average home in Kensington and Chelsea sold for £1,204,072 in August. That is the lowest borough average since May 2013.
It is £192,084 less than in August 2025, a fall of 13.8% in a year. The figures come from the HM Land Registry UK House Price Index, published on Wednesday 21 October.
Flats fell further still. The average flat or maisonette sold for £947,855, down 15.3%. Flats here last averaged less than that in April 2013.
Renting has gone the other way. The average private rent in the borough was £3,739 a month in September, up 3% in a year, according to the Office for National Statistics. That is the highest of any London borough.
A quarter off the 2022 peak
The borough average peaked at £1,656,986 in September 2022. August’s figure is £452,914 below that, a fall of 27.3% in under four years.
August was also down 4.2% on July alone. London as a whole rose 0.7% over the same month, and England rose 0.2%.
By property type
Every type of home in the borough is cheaper than a year ago. Flats, which make up most sales here, fell furthest.
| Type | August 2026 | Change in a year |
|---|---|---|
| Detached | £4,344,621 | -9.5% |
| Semi-detached | £2,995,521 | -4.4% |
| Terraced | £2,385,591 | -7.5% |
| Flat or maisonette | £947,855 | -15.3% |
| All types | £1,204,072 | -13.8% |
The average for first-time buyers was £1,020,436, down 14.5%. Buyers paying cash averaged £1,182,052; buyers with a mortgage averaged £1,221,566.
Third-steepest fall in London
Only two London areas fell faster over the year to August, both in central London:
- City of London: down 14.6%, to £726,633
- City of Westminster: down 14.3%, to £887,206
- Kensington and Chelsea: down 13.8%, to £1,204,072
- Tower Hamlets: down 13.3%, to £447,950
- Camden: down 10.6%, to £798,486
Further west and south the picture is milder:
- Hammersmith and Fulham: down 5.1%, to £754,825
- Wandsworth: down 5.3%, to £694,210
- London: down 2.2%, to £554,430
- England: up 0.4%, to £293,525
Two London boroughs, Kingston upon Thames and Barking and Dagenham, rose by more than 4%.
Kensington and Chelsea is still the most expensive local authority area in the country. Westminster, in second place, is £316,866 behind.
The Land Registry’s own summary for August says falling flat prices drove London’s annual decline. Flats make up half of all sales in London, against about a fifth across Great Britain. London flats fell 5.0% in the year, while London houses rose.
Rents keep climbing
The ONS rent figures run a month ahead of the price index, to September 2026. For Kensington and Chelsea they show:
| Home | Average monthly rent, September 2026 |
|---|---|
| One bedroom | £2,674 |
| Two bedrooms | £3,475 |
| Three bedrooms | £4,130 |
| All homes | £3,739 |
The all-homes average was £3,629 in September 2025, so a typical tenant now pays £110 a month more. Rents in the borough dipped slightly in the spring, then rose again from July.
Westminster is the next most expensive borough to rent in, at £3,209. The London average is £2,338, up 3.5%.
The rent figures come from the ONS Price Index of Private Rents, which measures rents paid by existing tenants as well as new lets.
Read these figures with care
- This is a mean average, not a median. In a borough with studio flats and £30 million houses, one unusual sale can move it.
- Very few homes are changing hands. The latest month with a published sales count is June 2026, with 74 sales in the whole borough. June 2025 had 120. Counts for July and August are not out yet.
- The latest months will be revised. July was first published at £1,232,640. This release moves it up to £1,257,453. August will move too, in either direction.
That July revision also changes the flat figure we reported last month. July’s flat average is now £991,651, not £971,688. It is still below £1 million.
What it means for you
If you are selling. Price from completed sales on your street in the last few months. A valuation from 2022 is now likely to be well out of date.
If you are buying. The borough average hides very different markets, from Knightsbridge to Dalgarno. Check the sold prices for the actual block or street.
If you are remortgaging. Lenders use indexed values. A fall of this size can move you into a different loan-to-value band, and with it a different rate.
If you rent. Falling sale prices have not fed through to rents. Your landlord can only raise the rent in the ways your tenancy allows; the council’s private renting advice sets out where to get help.
If you own a home near £2 million. The High Value Council Tax Surcharge starts in April 2028, on homes valued at £2 million or more as at 2026. Our guide is Kensington mansion tax: £2,500 to £7,500 a year from 2028.
The September 2026 house price index is due on Wednesday 18 November 2026.
For the longer run of figures, see our Kensington house prices page. For what is being built, see Kensington planning news.
Have your say