
Kensington and Chelsea's claimant count rose by 45 to 3,510 in October. That is 100 fewer than a year ago, while London and the UK are both higher.
Overview
3,510 people in Kensington and Chelsea were claiming unemployment-related benefits in October. That is 45 more than in September and 100 fewer than in October 2025. The rate is 3.4% of residents aged 16 to 64, the fourth lowest of London’s 33 local authorities.
The figures were published today by the Office for National Statistics. (ONS claimant count via nomis)
Down on the year while London rises
The borough is moving the other way from the capital. Over the past 12 months:
- Kensington and Chelsea: down 100, from 3,610 to 3,510
- London: up about 2,100, from 348,915 to 351,020
- United Kingdom: up about 57,100, to 1,707,320
London and the UK both reached their highest totals of the past 13 months in October. London’s rate is 5.6% and the UK’s is 3.9%.
The ONS has also revised September. The borough figure we reported last month, 3,520, is now 3,465. So September was a small rise on August, not the year’s biggest, and October is the larger increase of the two.
The last 13 months
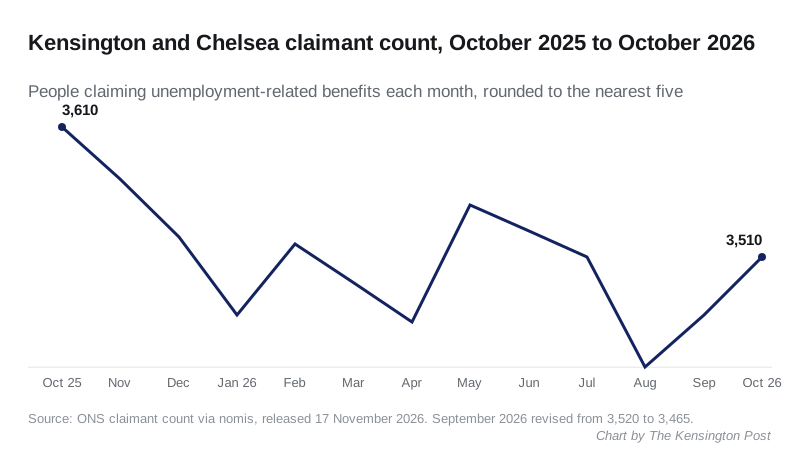
| Month | Claimants | Rate (16 to 64) |
|---|---|---|
| October 2025 | 3,610 | 3.5% |
| January 2026 | 3,465 | 3.4% |
| May 2026 | 3,550 | 3.5% |
| August 2026 | 3,425 | 3.4% |
| September 2026 (revised) | 3,465 | 3.4% |
| October 2026 | 3,510 | 3.4% |
How the borough compares
Only three London authorities have a lower rate:
- City of London: 1.2%
- Richmond upon Thames: 2.6%
- Kingston upon Thames: 3.2%
Westminster is at 4.0% and Hammersmith and Fulham at 4.8%. Newham and Barking and Dagenham have the highest rates in London, both 7.5%.
Inside the borough
Ward figures for October came out at the same time this month. They show how uneven the borough is:
| Ward | Claimants | Rate |
|---|---|---|
| Dalgarno | 340 | 7.0% |
| Golborne | 420 | 6.6% |
| Chelsea Riverside | 315 | 5.9% |
| Notting Dale | 350 | 5.7% |
| Colville | 295 | 5.2% |
| Queen’s Gate | 75 | 1.2% |
| Campden | 65 | 1.1% |
Dalgarno, Golborne and Notting Dale are all in North Kensington, W10. Together with Chelsea Riverside they hold 1,425 of the borough’s 3,510 claimants, about two in every five.
Only five of the 33 London boroughs have a higher rate than Dalgarno’s 7.0%. Campden, in W8, is the lowest ward at 1.1%.
The biggest rise in October was in St Helen’s ward, up 20 to 185. Chelsea Riverside rose by 15.
What it means for you
- The claimant count is not the unemployment rate. It counts people on Jobseeker’s Allowance and people on Universal Credit who are required to look for work. Some people in low-paid work are included.
- Figures are rounded to the nearest five, and earlier months are often revised, as September was this time.
- If you are looking for work, the council’s Families and Communities Employment Service offers one-to-one coaching, with appointments for up to six months.
- The November figures are due from the ONS in December.
Have your say