
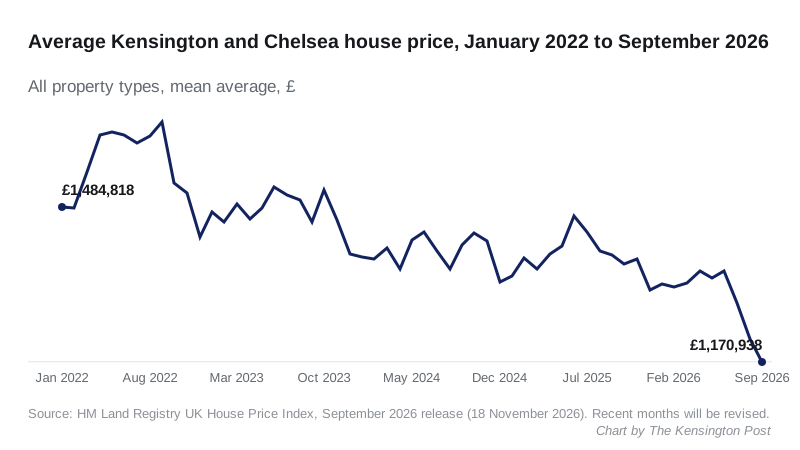
The average Kensington and Chelsea home sold for £1,170,938 in September, down 15.6% in a year. That is the lowest borough average since April 2013.
Overview
The average home in Kensington and Chelsea sold for £1,170,938 in September 2026. That is down 15.6% in a year and the lowest borough average since April 2013. First-time buyers now average £994,097, under £1 million for the first time since 2013. Rents rose 3.6% to £3,765 a month.
The average home in Kensington and Chelsea sold for £1,170,938 in September. No month since April 2013 has been lower.
It is £216,347 less than in September 2025, a fall of 15.6%. Prices fell 3.8% on August alone. The figures come from the HM Land Registry UK House Price Index for September 2026, published on Wednesday 18 November.
The borough is still the most expensive local authority area in the UK. Westminster, in second place, averages £861,130.
Nearly 30% off the 2022 peak
The borough average peaked at £1,656,986 in September 2022. Exactly four years on, it is £486,048 lower, a fall of 29.3%.
The fall has quickened since the summer. Prices dropped 4.8% in July, 5.6% in August and 3.8% in September. Before July, the yearly fall had been under 8%.
First-time buyers drop below £1 million
The average price paid by first-time buyers in the borough was £994,097 in September. That is down 16.2% in a year, from £1,186,574. It last stood this low in April 2013.
Every type of home is cheaper than a year ago:
| Type | September 2026 | Change in a year |
|---|---|---|
| Detached | £4,122,616 | -13.4% |
| Semi-detached | £2,812,400 | -9.8% |
| Terraced | £2,278,094 | -11.4% |
| Flat or maisonette | £926,482 | -16.6% |
| All types | £1,170,938 | -15.6% |
Flats make up most sales in the borough and fell furthest. The average flat was last cheaper in April 2013. Buyers paying cash averaged £1,149,403, and buyers with a mortgage £1,188,113.
Third-steepest fall in the country
The index covers 360 local authority areas across the UK. Only two fell faster than Kensington and Chelsea over the year, and both are its central London neighbours:
- City of Westminster: down 18.5%, to £861,130
- City of London: down 17.3%, to £663,585
- Kensington and Chelsea: down 15.6%, to £1,170,938
- Tower Hamlets: down 10.5%, to £456,306
- Camden: down 10.0%, to £789,180
Hammersmith and Fulham, next door to the west, fell 6.8% to £732,590. London as a whole fell 3.5%, to £545,579. England rose 0.8%, to £292,998.
The Land Registry’s summary for September says Inner London prices fell 7.2% in the year. It calls that the largest annual fall for Inner London since August 2009. Outer London was almost flat, at minus 0.1%.
Rents still rising
The Office for National Statistics publishes rents a month ahead of the price index. In October 2026 the average private rent in Kensington and Chelsea was £3,765 a month, up 3.6% in a year. It is the highest of any London borough.
| Home | Average monthly rent, October 2026 |
|---|---|
| One bedroom | £2,691 |
| Two bedrooms | £3,500 |
| Three bedrooms | £4,163 |
| Four or more bedrooms | £5,772 |
| All homes | £3,765 |
That is £26 a month more than in September. Westminster, the next most expensive borough to rent in, averages £3,217 and is down 0.2% on the year. The London average is £2,350, up 3.8%.
The rent figures come from the ONS Price Index of Private Rents, which covers existing tenancies as well as new lets.
Read these figures with care
- This is a mean average, not a median. In a borough with studio flats and £30 million houses, a handful of unusual sales can move it.
- Very few homes are changing hands. The latest month with a published sales count is July 2026, with 84 sales in the whole borough. July 2025 had 162.
- The latest months will be revised. This release moved August up, from £1,204,072 to £1,217,189. September will move too, in either direction.
What it means for you
If you are selling. Price from completed sales on your street in the last few months. A valuation from 2022 is likely to be well out of date.
If you are buying a first home. The borough average for first-time buyers is now under £1 million. Averages here hide very different markets, from Knightsbridge to Dalgarno, so check the sold prices for the actual block or street.
If you are remortgaging. Lenders use indexed values. A fall of this size can move you into a different loan-to-value band, and with it a different rate.
If you rent. Falling sale prices have not fed through to rents. Your landlord can only raise the rent in the ways your tenancy allows. The council’s private renting advice sets out where to get help.
The October 2026 house price index is due on Wednesday 17 December 2026. For the longer run of figures, see Kensington house prices.
Have your say